Infographics – just a fad or still relevant?
Infographics are a unique way of presenting ideas and data. To do them well and make them stand out from the crowd, you need a plan.We’ve had a few clients struggle to get buy-in from their managers when they’ve wanted to create an infographic as another way to share content. This is often down to a lack of understanding of what an infographic really is and what it’s trying to achieve. It’s just a pretty picture after all, right? 😉
When they first started appearing, we couldn’t get enough of them, however, they don’t continue to have the impact on SEO that they once used to. That doesn’t mean that they’re redundant, though. In an age where we are being continuously bombarded with information, we all value easy to digest content that grabs (and holds!) our attention.
Helping you get buy-in
Here are 3 reasons infographics are still relevant:
- Traffic. An infographic is easier to consume and is likely to encourage clicks through to your site, more so than your blog.
- Brand awareness. You will obviously brand your infographics with your logo so this will help improve awareness and generate direct traffic to your site over time.
- Referrals. This content is more likely to get picked up and shared by other sources relevant to your business creating inbound referral links.
Before you start
Anyone who’s created an infographic before knows they’re not as simple as they may appear. It requires some creative thinking to make sure you’re presenting the information in a way that’s easy to understand – which is the point after all. This can be a fun process for the team to collaborate on.
Content or idea first?
Usually infographics are born out of data that you find yourself in possession of, such as company sales information, industry demographic insights or results from a survey you’ve run with customers.
But perhaps we should turn this around, and make sure everyone knows what data is available from around the business so that the marketing team can spot the opportunities for content as and when they arise. This would at least put us in a position to interrogate what’s available to see what insights we can get.
Case Study: Peer to Peer Business Lender
How we developed a unique targeting approach and improved lead volumes from direct marketing by more than 80%.
I say this with one caveat, however. Please don’t make an infographic for the sake of it. Otherwise it will become ‘just a pretty picture’, one that adds no real value, but wastes time and effort instead.
What’s the process?
- When you think you have something to develop, consider your objectives. What’s the message or story you’ll be trying to communicate?
- Is your audience going to find this interesting, informative or fun?
- What format could you use? Here are some examples:
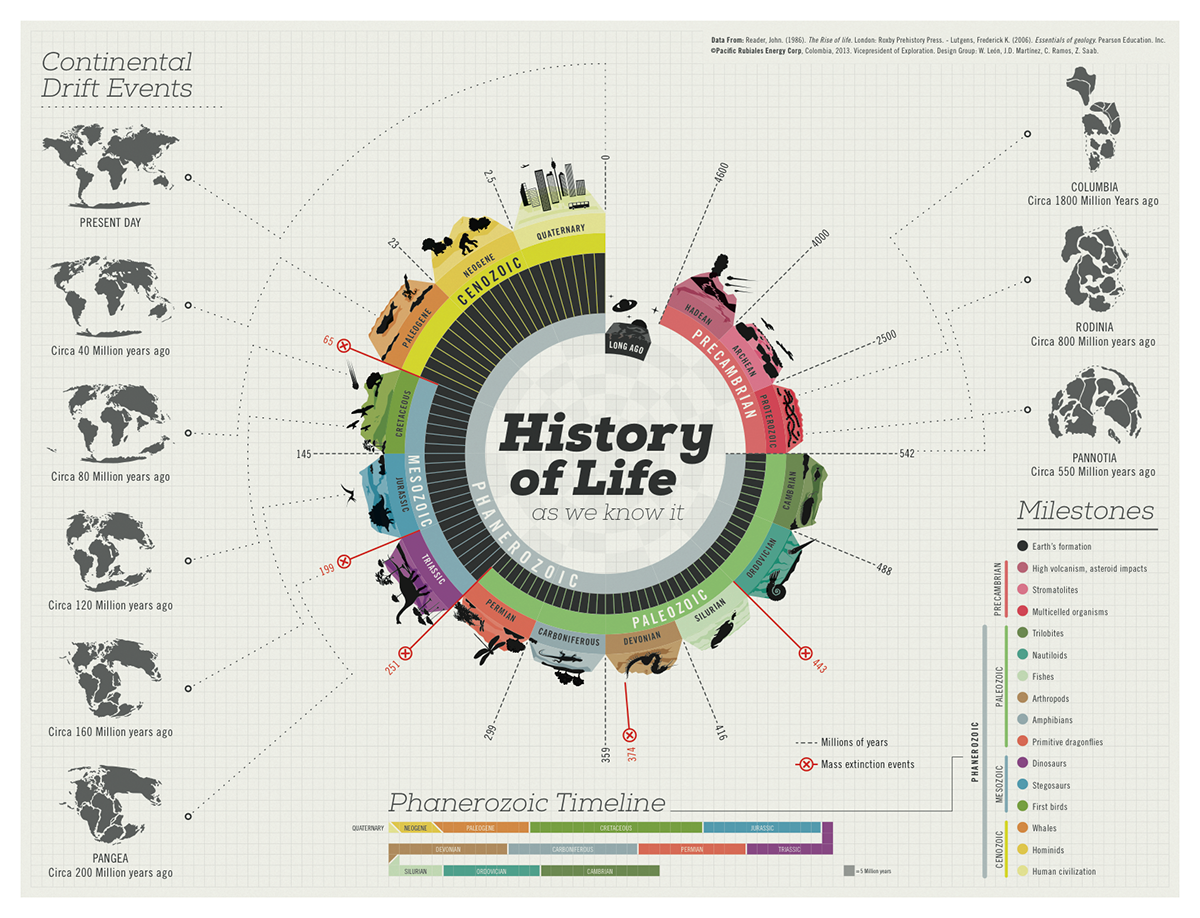
Static
This history of life infographic is a fantastic example of how you can provide a lot of information in a small space, while being clear and holding attention. And it's static! One of my faves.
Video
Animation can help bring statistics to life, making it even easier to consume. You have complete control over the story, dictating what the viewer sees and when, essentially spoon-feeding them. Here’s a great example using stats about ‘Things that might kill you… but probably won’t’ – enjoy!
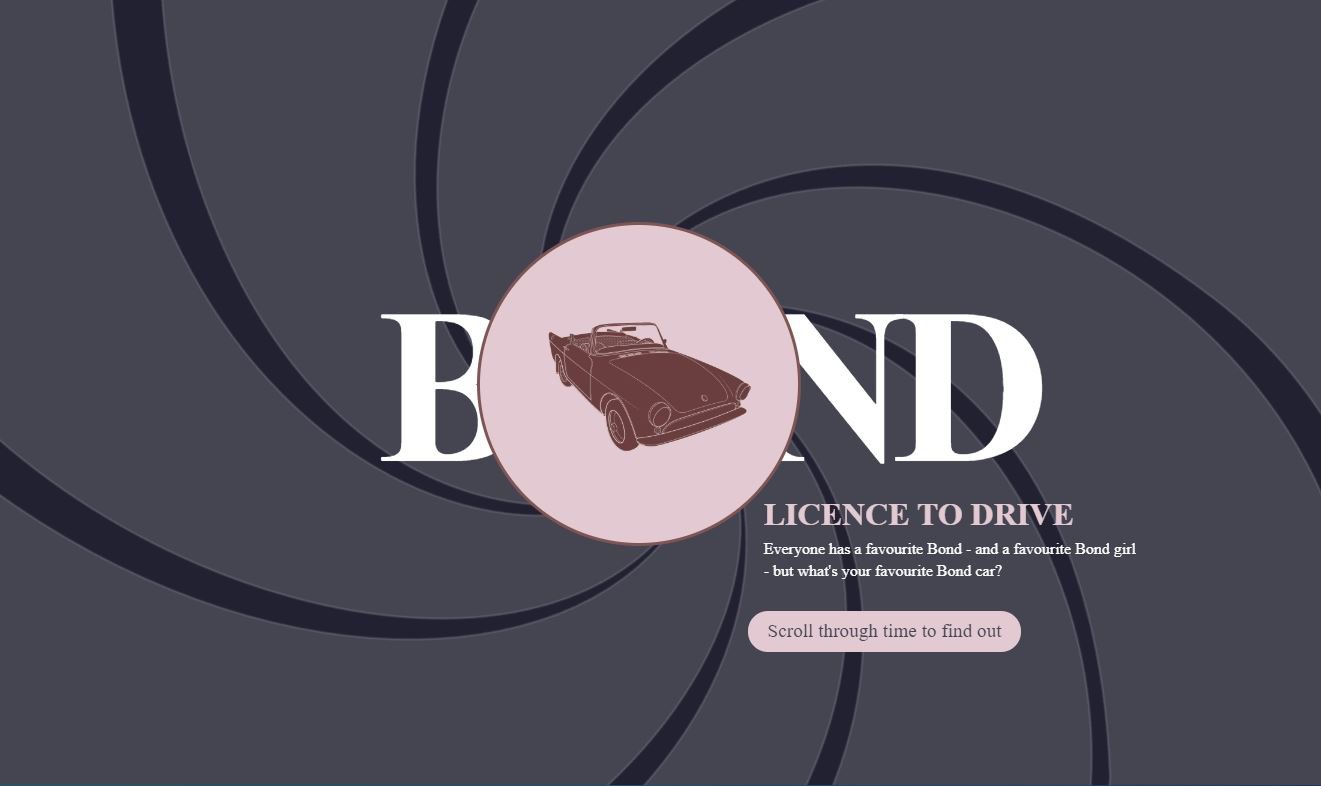
Interactive
Now, personally, I’m not interested in James Bond or cars particularly, but I enjoyed the experience so much I scrolled through the lot. Check it out here.
Mini
Not all infographics have to be huge. You could simply want to enhance a stale chart or table used in your product information.

4. What’s the call to action going to be?
5. Thinking about this beforehand will make briefing your objectives, data and preferred format into the design team a lot easier for you and them.
Share it far and wide
Unless you’ve created a square infographic, perfect for sharing visually on social media, pull out a section, specific stat or screenshot from the piece and use that to promote it on social media. Add it to your website too. From your social and website analytics you’ll be able to gauge the level of engagement it’s received and whether it’s been a success.
Remember:
- Don’t just make an infographic for the sake of it
- Make sure it’s relevant to your audience - it can still be fun
- Make it clear and super easy to read and understand
- Brand it
- Give it a clear call to action
- Make it shareable

Case Study: The Replace Base
An online retailer of mobile device repairs and replacement parts

Author
Amelia Caldecott
A qualified marketer with a Professional Diploma in Marketing, Amelia plays an important role in looking after The Marketing Eye's clients, primarily in the financial services, professional services and hotels sectors.
Client Partner / The Marketing Eye
Related Reading

Blog: Why Search Intent Matters More Than the Keyword Itself
by Darren Coleshill, 5 minute read

Blog: How Independent Retailers Are Using Shopify to Compete With the Big Players
by Darren Coleshill, 6 minute read